Share
Overview
The first quarter of 2024 saw the largest decline in the measurement of EV readiness in the Big 5 European markets recorded since Sophus3 commenced publication of the EV Index at the beginning of 2020. Germany experienced the biggest reversal, with consumer interest plummeting, but the picture was the same for the other markets although the swings were not quite as extreme.
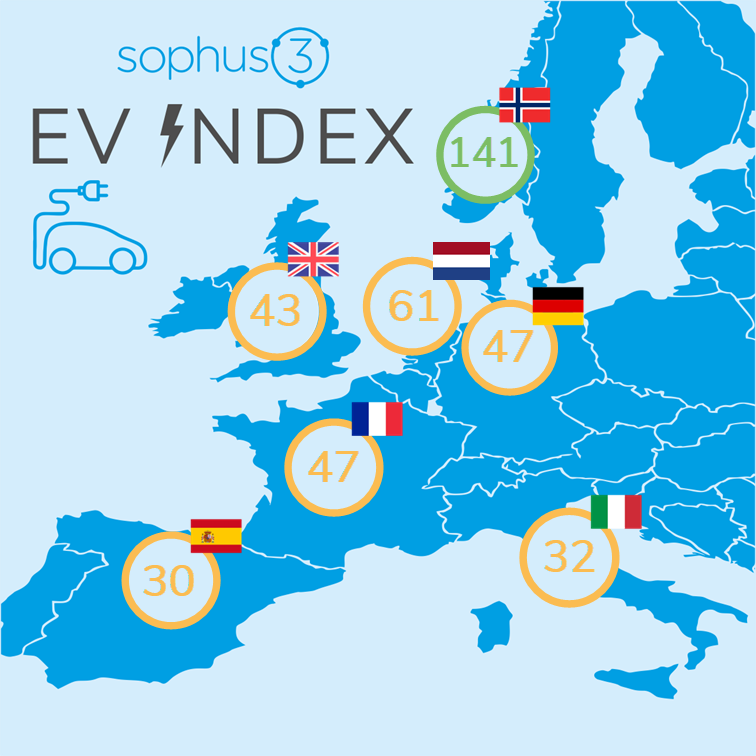
EV Index 2024 Q1
Figures in brackets show change from 2023 Q4
| EV Index | Consumer Interest | Affordability & Choice | Infrastructure | |
|
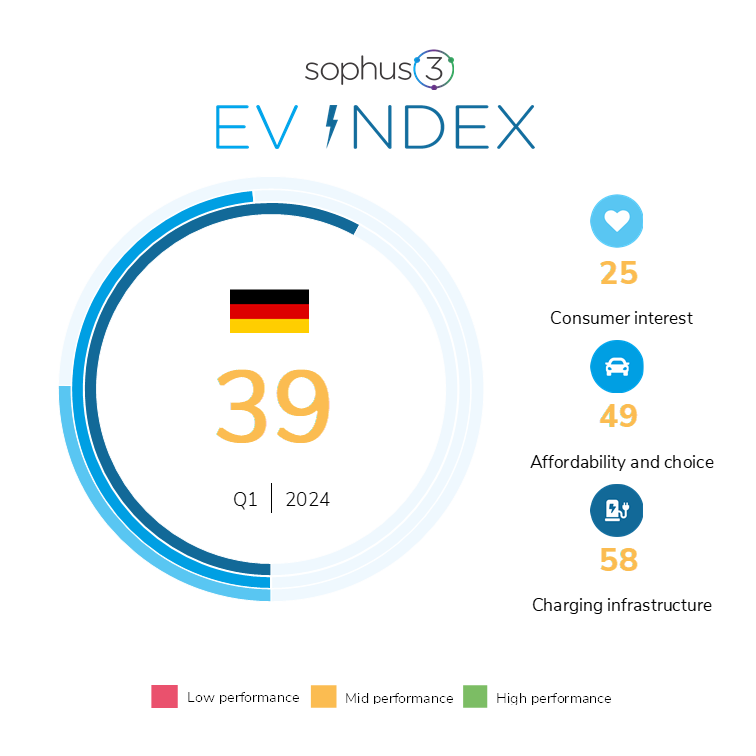
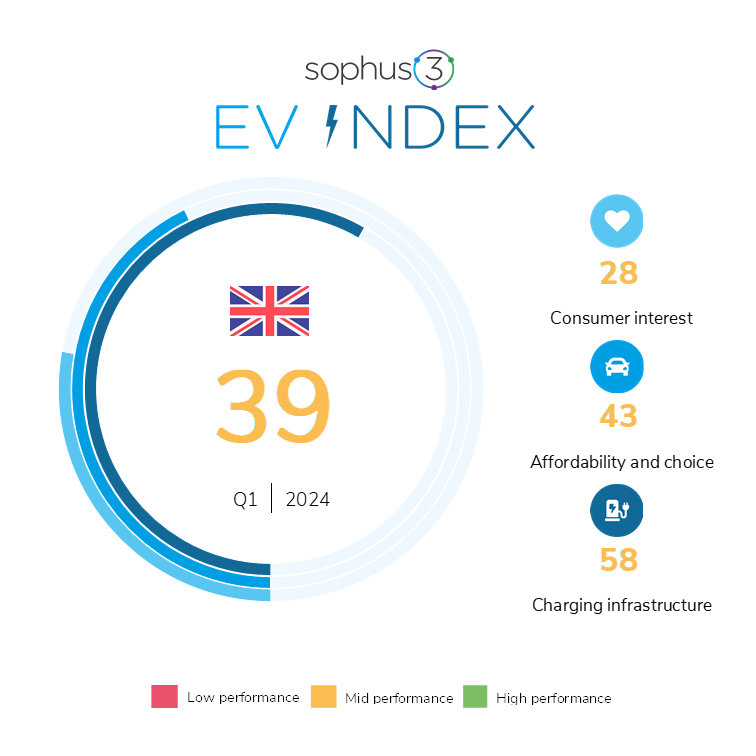
Germany |
39 (-8) |
25 (-11) |
49 (-5) |
58 (-1) |
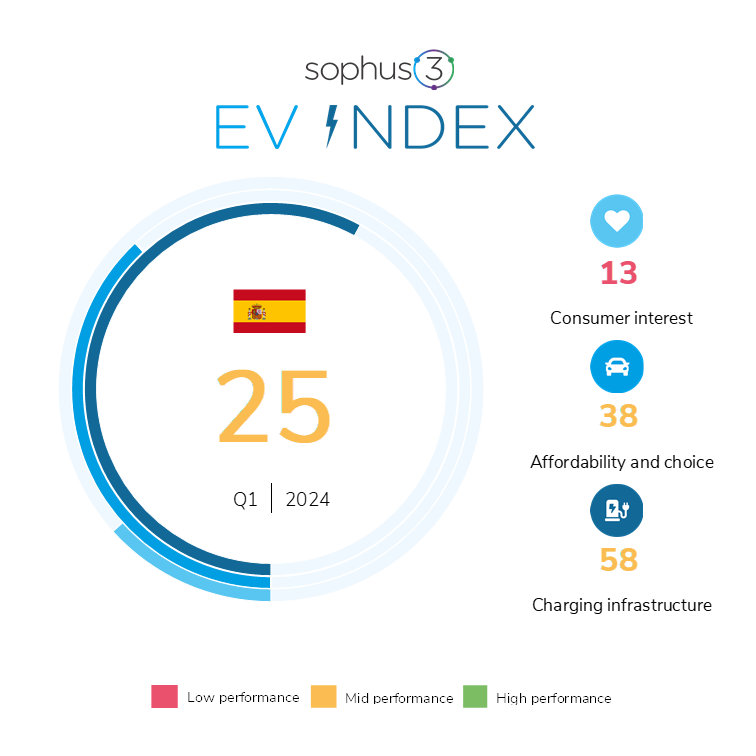
| Spain |
25 (-5) |
13 (-5) | 38 (1) |
58 (-1) |
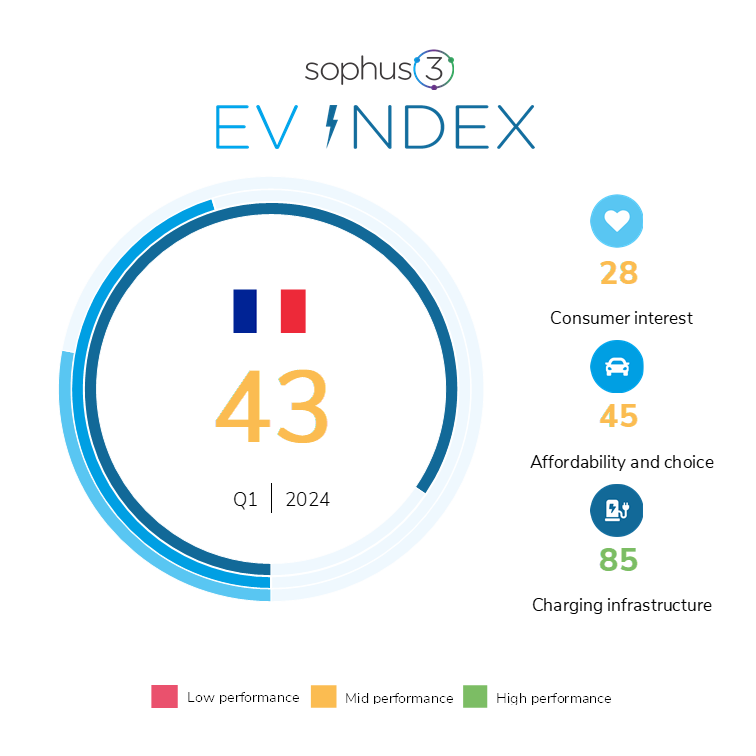
| France |
43 (-4) |
28 (-6) | 44 (0) |
85 (1) |
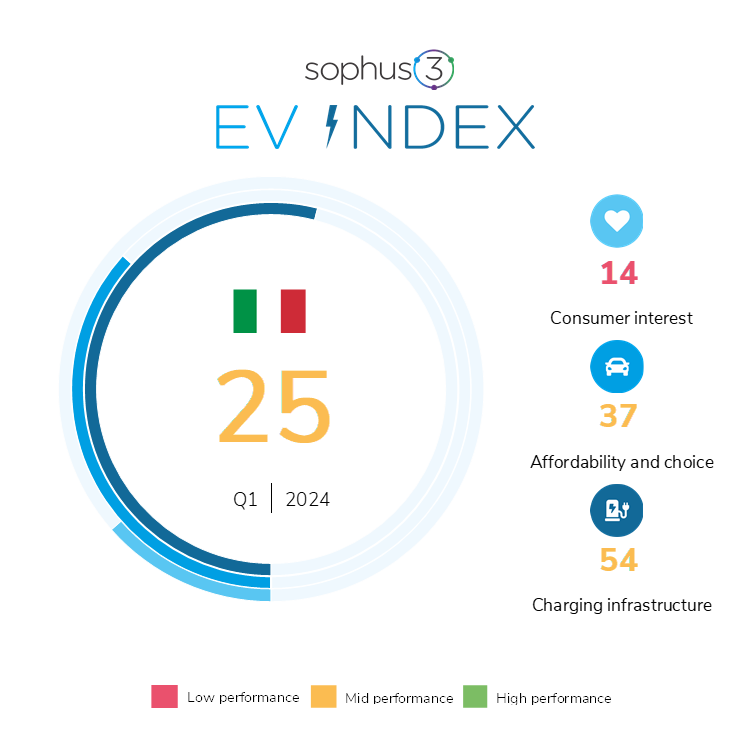
| Italy |
25 (-7) |
14 (-6) | 36 (-2) |
54 (0) |
|
UK |
39 (-4) | 28 (-4) | 43 (-2) |
58 (-3) |
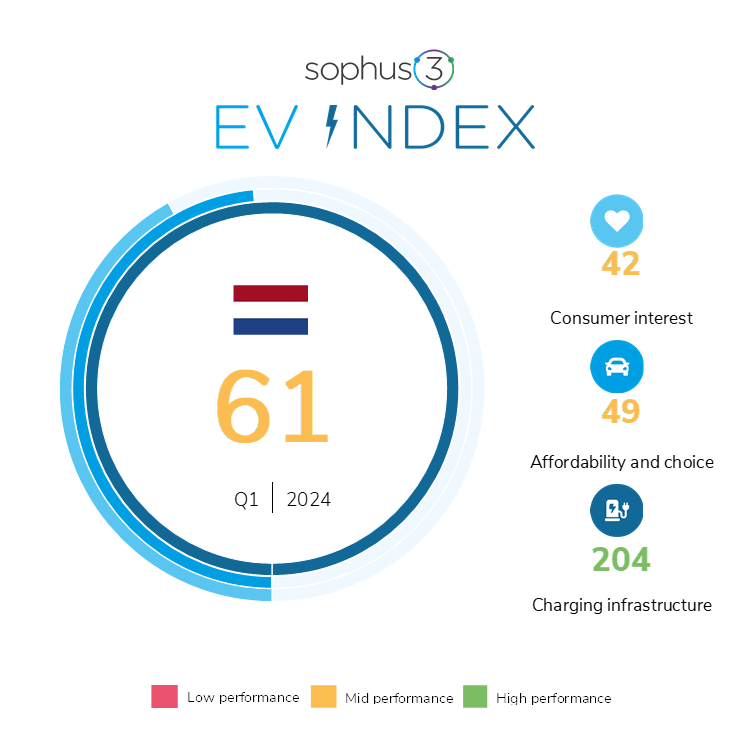
| Netherlands | 61 (0) | 42 (-3) | 49 (4) |
204 (4) |
|
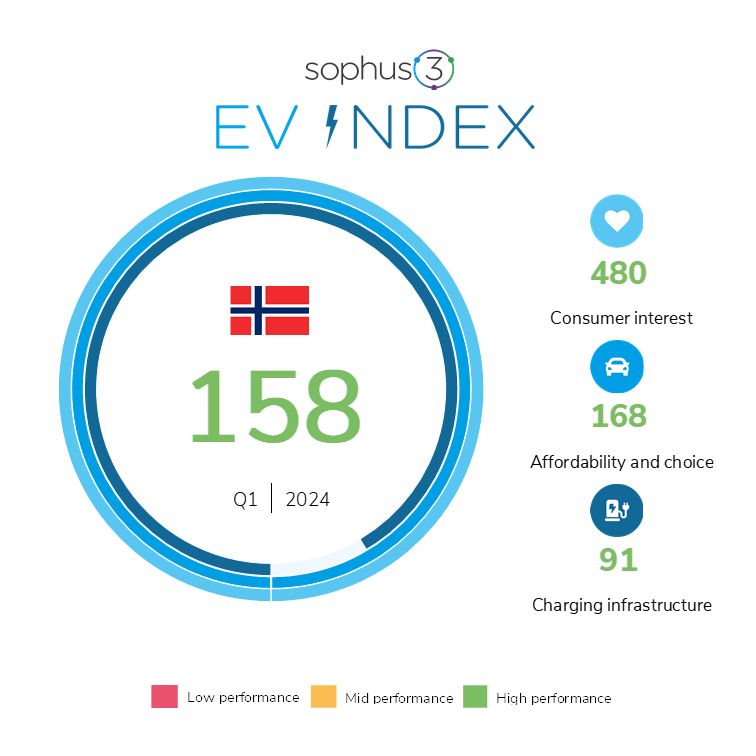
Norway |
158 (17) | 480 (192) | 168 (26) |
91 (0) |
(The Netherlands and Norway continue to provide benchmarks for comparison as they separately pursue more coercive strategies for the transition to e-mobility.)
EV demand stalls
The sudden removal of government subsidies for EV buyers in Germany at the end of last year no doubt partially explains the fall in online interest and demand in the vehicle market place. With EV sales for March much improved over January, this may be a hangover that is wearing off. In Italy, buyers are awaiting a policy announcement on EV support from their government, expectation of which is most likely suppressing current EV sales.
But, the ACEA registrations data for the first quarter shows that these negative trends are not isolated to those two markets; the market share of BEVs sold during Q1 across the whole of Europe was just 13.2% compared to their share of sales in 2023 of 15.4%.
However, consumers are not simply backtracking to petrol and diesel cars, both of which saw their market share shrink further during the first quarter. The growth area of the passenger car market so far this year has been conventional hybrids whose European volumes are up by nearly 20% year-to-date.
Pricing hurdle
The high price of EVs continues to be the major barrier to adoption, and we can see in the affordability column of the table above that the relative pricing of EVs compared to their fossil-fueled alternatives actually worsened in Germany, Italy and the UK during the period under review. Whilst some commentators have interpreted the latest sales trend as evidence of ‘faltering interest in EVs’, the rocketing European sales recorded by MG’s parent company, SAIC (+45% year-to-date), suggests that this is a simplification and that there remain plenty of buyers for competitively priced EVs.
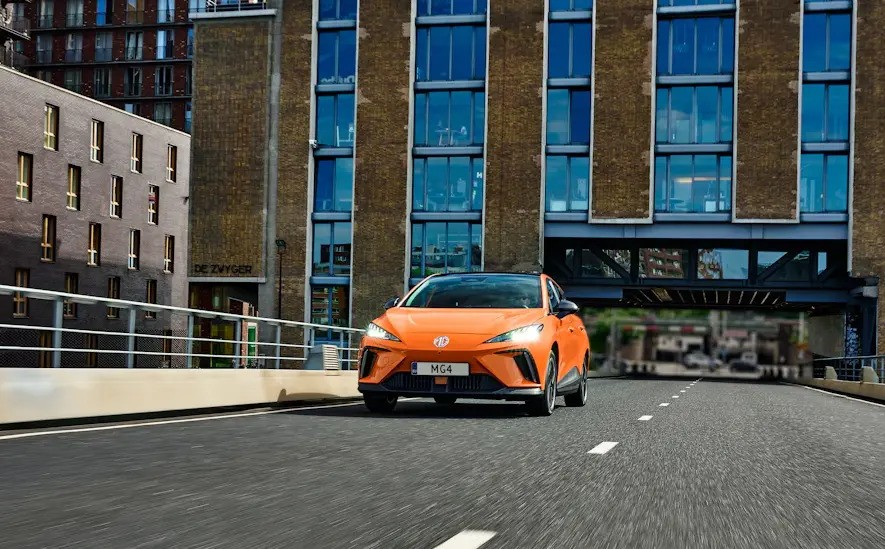
MG4 defying the simplification that consumer interest in EVs is waning.
Importance of charging infrastructure overstated?
The EV Index continues to show that the provision of public charging infrastructure is not the ‘deal breaker’ that it is suggested to be in many quarters. In all of the markets we analyse, infrastructure, at this point in time, is the strongest of the three pillars from which we calculate the overall EV Index score. The progress of France has been particularly impressive given the challenges its geographic size presents. This viewpoint is supported by recently published analysis from the Transport and Environment group which showed that the number of public charge points in the EU has tripled in the last three years, and that, last year, the network expanded faster than the electric vehicle fleet it serves. This said, it is important not to be complacent. If the targets of the various ZEV mandates in place are to be met, then the current growth of the public charger network will need to be maintained.
About
The EV Index from Sophus3 provides an objective measure of the readiness of the vehicle market to enable and encourage the mainstream adoption of electric vehicles (EVs).
The index is formed from three pillars, each measuring distinct factors that help or hinder electric vehicle acquisition. First of these is the consumer appetite to buy electric, the second is the capability of the automotive companies to supply these cars, and the third is the availability of suitable charging infrastructure.
A score of 100 represents parity in the attractiveness, availability, pricing and usability of an electric car compared with a conventionally fuelled vehicle.
We publish the EV Index for the UK, Germany, France, Italy, Spain, The Netherlands, and Norway.
A fuller explanation of the EV Index from Sophus3 can be found here.
If you would like to discuss this latest issue of the EV Index please contact: patrick.fuller@sophus3.com