Share

Overview
At the end of the last quarter we made some changes to the methodology by which we calculate elements of the EV Index. We detail the refinements below which are intended to give more accuracy to the measurement of the relative pricing of EVs and to the capability of public charging infrastructure to support the existing EV fleet within each national market. These improvements explain some minor changes within each market during the period in question, particularly in calculating the pricing differentials between EV and ICE vehicles.
Having said that, the relative differences between individual markets continues to be explained by two factors. Firstly, variations in and adjustments to the array of national policies designed to support EV adoption. Secondly, the focus that car makers give individual markets based on their assessment, rightly or wrongly, of the commercial return that promoting EVs in each market is likely to produce.
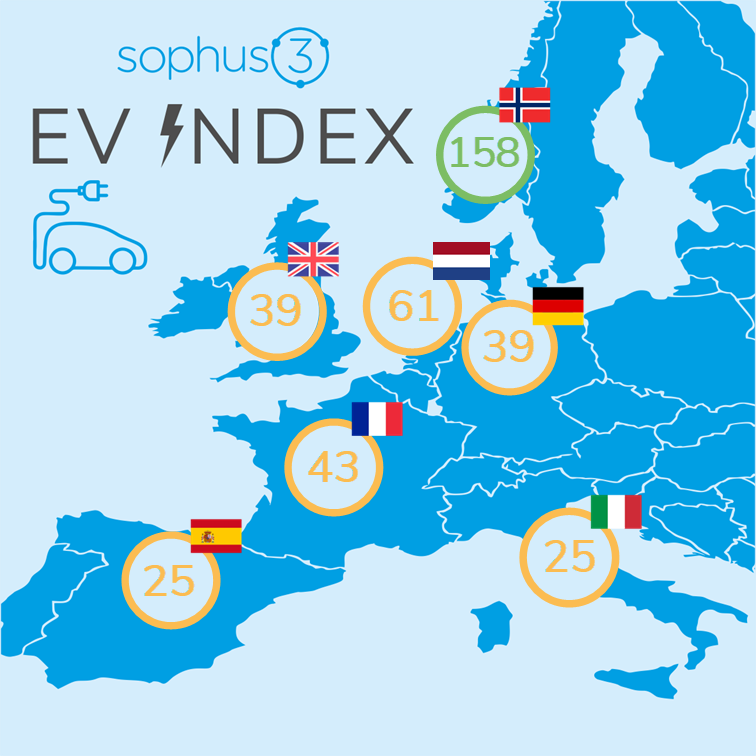
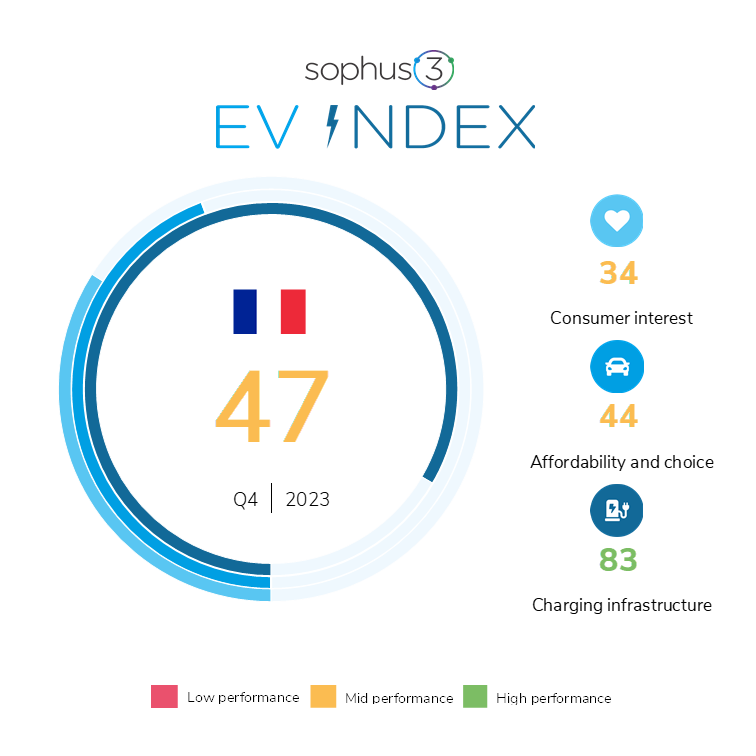
The ‘big picture’ in the last quarter of 2023 saw our measurement of EV readiness for the seven European markets that we monitor record little growth. The Big 5 markets, in which 70% of the region’s cars are sold, performed particularly poorly. The Index for Germany and Spain remained entirely static, whilst in the UK and Italy there were improvements of a single point. France scored highest from this group with the index rising by just two points.
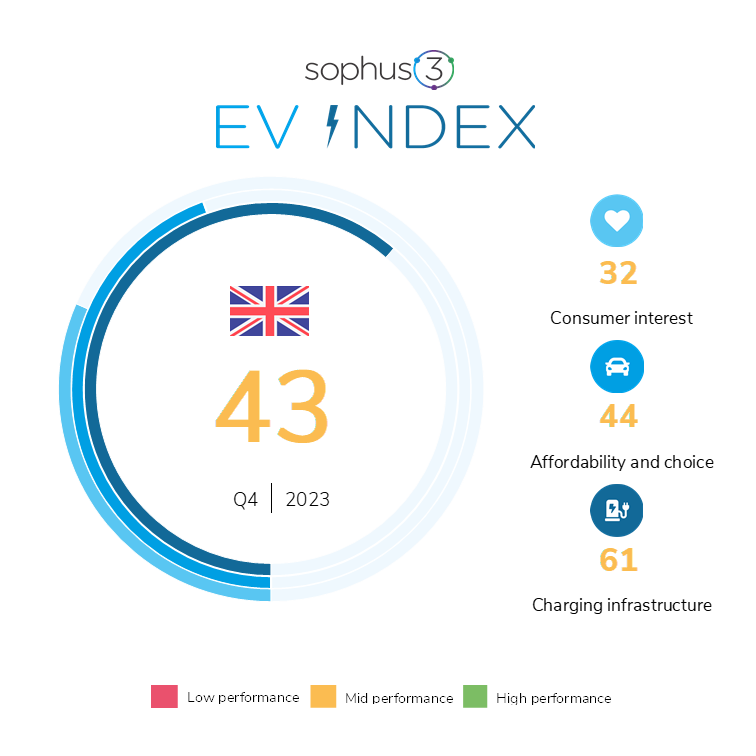
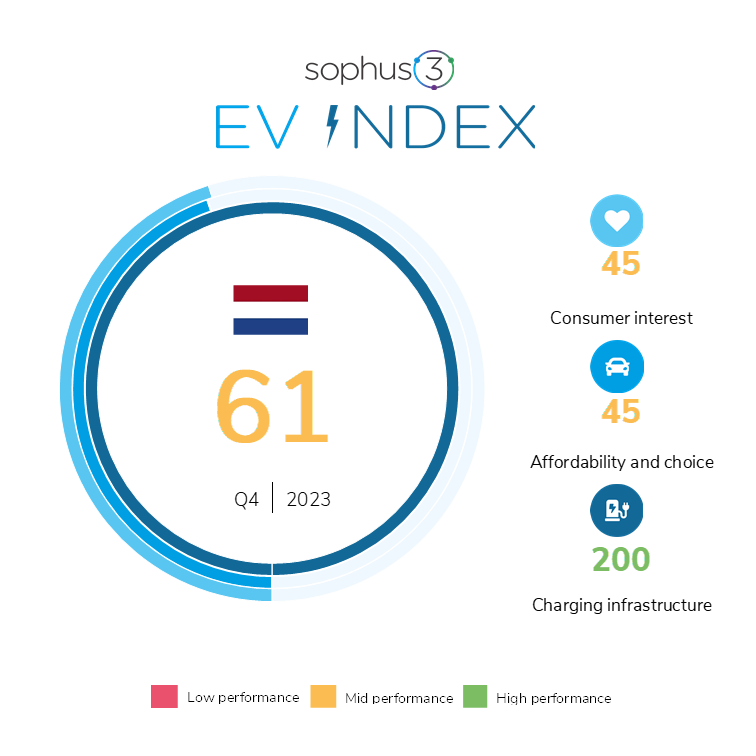
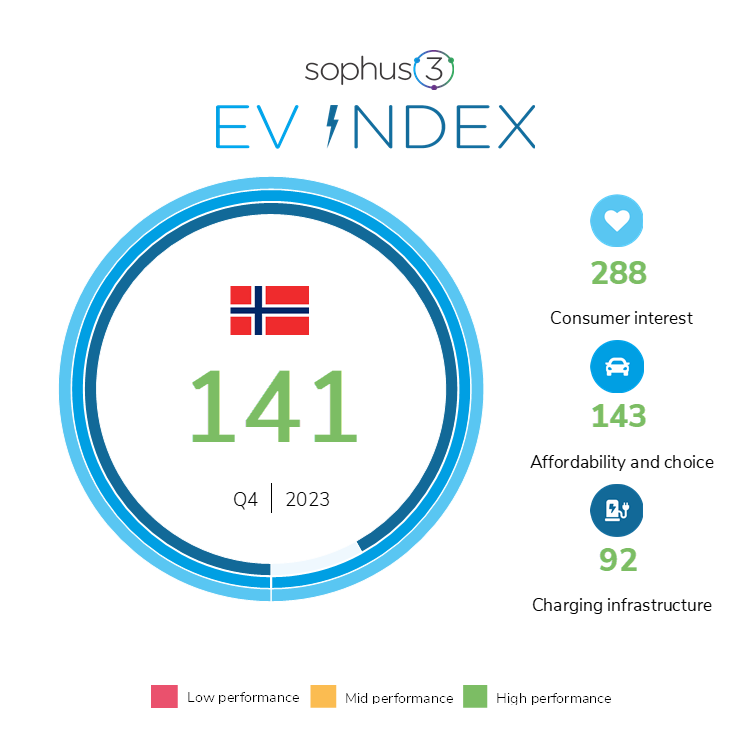
EV Index 2023 Q4
Figures in brackets show change from Q3
| EV Index | Consumer Interest | Affordability & Choice | Infrastructure | |
| Germany | 47 (0) | 36 (-3) | 53 (8) | 59 (-3) |
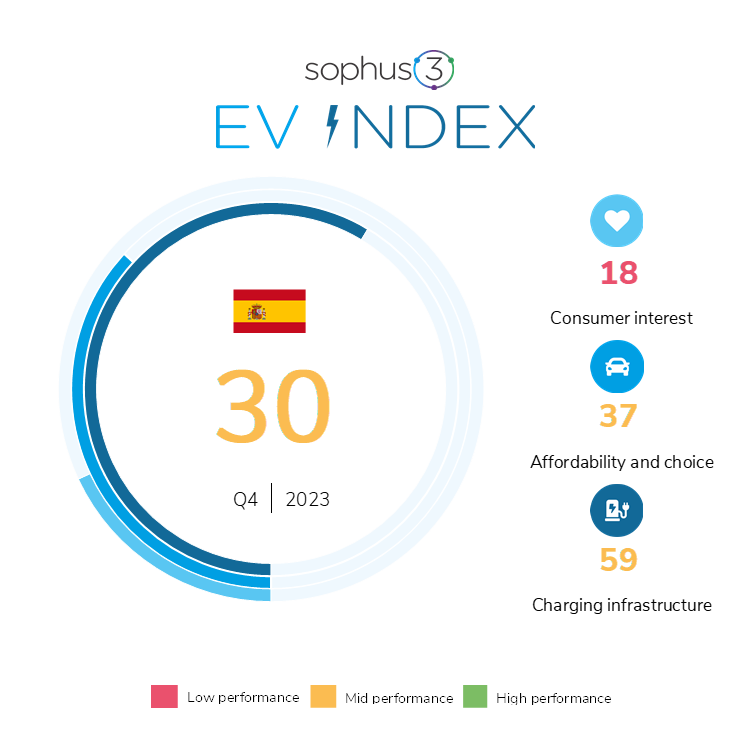
| Spain | 30 (0) | 18 (0) | 37 (0) | 59 (-1) |
| France | 47 (2) | 34 (2) | 44 (2) | 83 (4) |
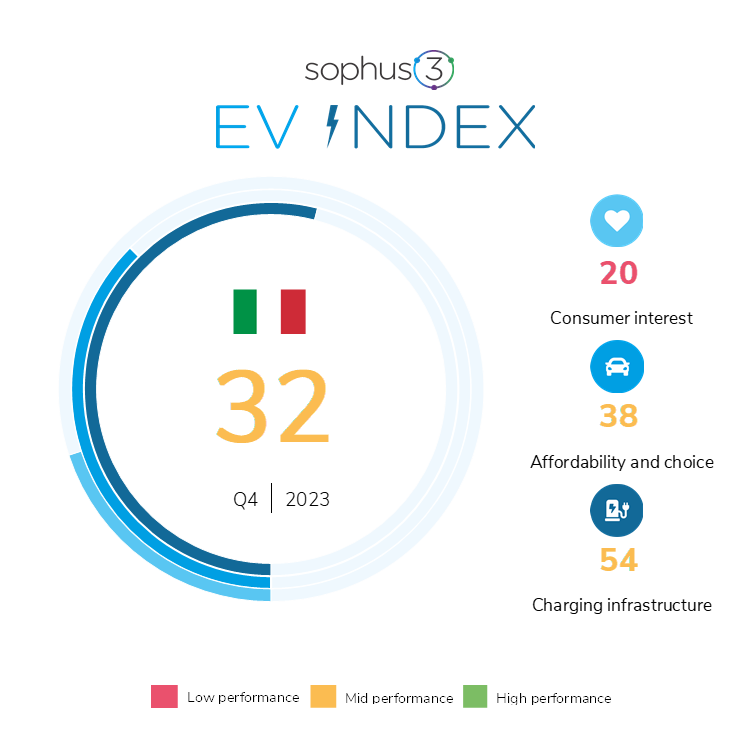
| Italy | 32 (1) | 20 (1) | 38 (-1) | 54 (0) |
| UK | 43 (1) | 32 (-1) | 44 (3) | 61 (-2) |
| Netherlands | 61 (3) | 45 (3) | 45 (1) | 200 (0) |
| Norway | 141 (-4) | 288 (-64) | 143 (2) | 92 (-1) |
The above is very much a continuation of what we have seen in the previous two quarters. The propensity of the European car market to transition to electric has slowed and is effectively at a near standstill within the Big 5. Spain and Italy remain the laggard markets with chronically low levels of consumer interest in either researching or purchasing an electric car.
This general torpor is reflected in the real-world sales data with registrations of battery electric vehicles flat-lining during the last quarter of the year and, in many markets, going into reverse during December. BEV registrations in that month were down -25% in Europe as a whole and down -48% in Germany.
In Germany, the largest European market for EVs, this particularly poor performance was the result of the coalition government’s budget crisis which led to the abrupt ending of the environmental bonus — a subsidy of €4,500 available to private buyers of electric cars. The withdrawal of the Umweltbonus is thought to have affected nearly 30,000 EV sales according to the ZDK (Deutsches Kraftfahrzeuggewerbe Zentralverband). Whilst many manufacturers offered to absorb the resulting price increases, the impact on registrations remained severe. ‘EV only’ brands were particularly affected with, for example, registrations of Tesla and Polestar cars both down more than 70% during the month.
At year end, EV registrations for the EU, EFTA and the UK as a whole represented a 15.4% share of all cars sold during the year. This was an improvement of just 1.8% compared to 2023. More worryingly, all of the markets of the Big 5, with the exception of France, fell below that already low bar, recording negligible year-on-year growth.
(Amongst the markets we monitor Norway remains the outlier and is the only market with an EV Index score over 100. There, government tax and subsidy have made EVs the default consumer choice with manufacturers withdrawing more and more ICE models from sale. Even so, in the last quarter we can see a dip in the index as car purchase dropped sharply in December with EV market share contracting, accompanied by a tailing-off in online interest.)
EV affordability
From Q4 of 2023 we have extended our comparison of the relative pricing of EV and fossil-fuelled cars to look at the top 20 best selling models of both powertrains in each market. (Previously we chose the top 10 models for the whole of Europe and then compared local pricing — which in some markets meant cars with negligible sales were distorting the picture of what drivers were paying for cars of either powertrain.)
This change has given more clarity to the market specifics affecting EV adoption. For instance, it shows that Germans spend more on combustion engine cars resulting in a lower ICE to EV differential, whereas the preference for smaller and cheaper cars in Italy, Spain and France means there remains a much higher affordability gap in those markets.
Charging infrastructure
Similarly we have made two changes to how we assess the capability of a market’s EV charging infrastructure. If a market has less than 10 public charge points per BEV (the European Union’s suggested target ratio of chargers to electric vehicles) then its infrastructure score will be downgraded. We also factor in how far a country’s total fleet adoption has progressed. If a market is still in the early stages of electrification with EVs only a small percentage of cars in use, then, again, the infrastructure score will be downgraded to reflect the extent of the growth required to meet the needs of a much expanded electric fleet and the rapidity with which that will need to happen.
As can be seen from the infrastructure column in the main table, shortages of public chargers do not appear to be the main deterrent to EV acquisition that so much of the public discussion would have us believe. A recent piece in the Financial Times, Electric vehicle charging crisis is overdone, expanded on that view noting that the ‘private’ home charger network was the critical component to support an enlarged electric vehicle fleet — and that in most markets the domestic network was more than adequate. The article concluded that “the cost of EVs, not insufficient charging infrastructure, is the real barrier to adoption”. S&P’s recently published global 2024 EV forecast is similarly upbeat about the progress of public charger provision: “The number of AC and DC chargers installed globally surged from 3 million in 2019 to more than 10 million in 2022. The count will increase to more than 15 million globally in 2023, and we forecast 70 million in 2030.” However, where the infrastructure index falls between quarters this usually indicates that the expansion of the EV fleet is outstripping public charger provision in those markets (rather than that the charger network is shrinking). It is important therefore not to be complacent about the need to retain momentum in the area of infrastructure provision.
New initiatives to promote EV adoption
Governments around Europe will be following recent French policy initiatives aiming to encourage EV ownership among low income groups. A ‘Social Leasing’ scheme, under discussion since 2022, is finally launching during the first quarter of 2024. This enables French residents earning less than €15,400 to lease an electric car without a deposit for as little as €54 per month. (Additionally, to qualify, the driver must travel more than 15 km to their workplace or drive over 8,000 km a year.) The list of eligible vehicles does not include Chinese models which have been explicitly excluded from this and broader EV incentive schemes by the introduction of new criteria targeting CO2 emissions during manufacture.
The Italian government is considering a series of measures to boost EV adoption including, potentially, a social leasing scheme similar to that implemented in France. This would target the most polluting cars over 20 years in age and support purchase of a replacement EV with a subsidy of up to €13,750 for those whose annual earnings were below €30,000. A detailed proposal will be presented to car industry representatives at the start of February.
Similar schemes are in an early stage of discussion for possible implementation in the Spanish market. In November, Spain’s ‘Moves III’ Plan was extended seven months “to maintain the promotion of the electrification of transport and make firm progress towards achieving the goal of having 5.5 million electric vehicles on the road by 2030”.
Looking ahead
The immediate future looks uncertain for the EV market in Europe with pricing remaining the key barrier to a smooth transition to mass market adoption. True, a number of European manufacturers have revealed their intentions to introduce sub-€25,000 EVs, but many of these vehicles have advanced little beyond the drawing board.
Past experience also suggests that the first release of these smaller models is likely to be of higher-trim variants commanding premium prices with the lower-priced versions following some months behind.
Even in advance of its launch at February’s Geneva motor show the pricing of the much heralded all electric Renault 5 has crept upwards. UK customers for example have been told to expect prices starting at GBP 30,000 — more than €35,000 at current exchange rates — with its arrival now timed for 2025.
The new Chinese brand entrants may be waiting in the wings with more affordable products, but for the moment such developments are on hold as the EU Commission reviews the subsidy their manufacture receives from the Chinese state and considers possible tariff increases to stymie any price advantage they might enjoy.
About
The EV Index from Sophus3 provides an objective measure of the readiness of the vehicle market to enable and encourage the mainstream adoption of electric vehicles (EVs).
The index is formed from three pillars, each measuring distinct factors that help or hinder electric vehicle acquisition. First of these is the consumer appetite to buy electric, the second is the capability of the automotive companies to supply these cars, and the third is the availability of suitable charging infrastructure.
A score of 100 represents parity in the attractiveness, availability, pricing and usability of an electric car compared with a conventionally fuelled vehicle.
We publish the EV Index for the UK, Germany, France, Italy, Spain, The Netherlands, and Norway.
A fuller explanation of the EV Index from Sophus3 can be found here.
If you would like to discuss this latest issue of the EV Index please contact: patrick.fuller@sophus3.com