The purpose of the Sophus3 EV Index is to provide an objective measure of the readiness of the vehicle market to enable and encourage the mainstream adoption and ownership of electric vehicles.
Below we explain in more detail how the index is put together. A fuller description of the methodology we use is available on request.
How It Works
Three pillars of measurement
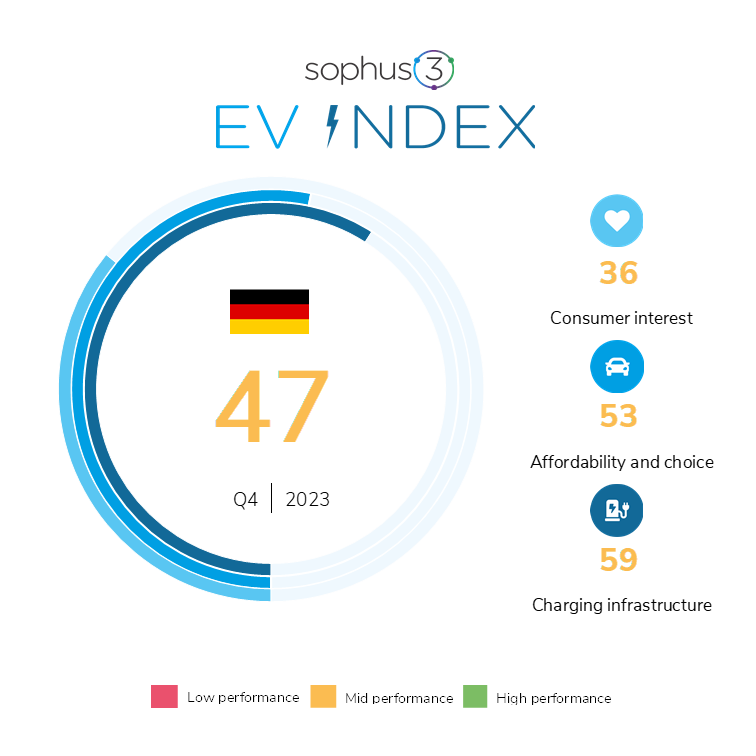
The EV Index is formed from three pillars each measuring distinct factors that help or hinder electric vehicle acquisition.

Consumer interest
We follow the user journey from digital to sale. We analyse, then factor in, Google search activity to understand the split between interest in EV and ICE vehicles.
Using data from car brands’ digital platforms – which they share through the Sophus3 eDataXchange project – as well as data from Similar Web, we measure the proportion of the huge online audience to automotive sites who visit an EV model page compared to those who visit pages for conventional ICE (internal combustion engine) powered cars.
We also factor in the actual number of vehicles sold by powertrain to see how much consumer interest online translates into purchasing a fully electric vehicle.
An index score of 100 for consumer interest means that curiosity about both powertrains is the same.

Affordability and choice
Here we measure, firstly, the proportion of electric models on offer from manufacturers compared to ICE cars as an indication of the choice consumers have. We then compare the pricing of the two types of vehicle to calculate any premium that an EV buyer must pay. Pricing is central to differentiating how accessible electric cars really are to consumers, rather than being halo products that a manufacturer expects to sell only in small numbers. (‘On the Road’ pricing is used in the calculation which includes all taxes, delivery and other charges. Where a central government subsidy is offered on purchase of an EV, this is included within the price calculations.)
Our pricing is sourced through desk research on manufacturer websites of the average OTR of the 20 best selling ICE and 20 best selling EV cars in the region.
An index score of 100 for affordability and choice means that an equal number of electric and ICE models are offered, and that the pricing of equivalent models is the same.
Charging Infrastructure
This pillar measures the availability of public charging points for EVs and compares this to the availability of fuel pumps to support ICE cars. This is a measure designed to show the change over time towards more available public chargers. We do not factor in at home chargers or private business chargers even though these make up a large amount of the charging infrastructure.
Charging infrastructure is weighted against the size of the current BEV fleet in the market to measure whether chargers are keeping up with registrations. It is also weighted against the overall size of the passenger car fleet to appreciate that the journey won’t be complete whilst the majority of vehicles on the road are still combustion cars.
An index score of 100 represents a parity between the ease with which the driver of either type of vehicle can refuel/recharge.
Combining the data
The three separate indices are combined mathematically to give a single number that represents the readiness of a market to go electric. However, in publishing the index we show the contribution of each element because significant shortcomings in one area could effectively stymie progress in other areas. The three pillars are therefore displayed in traffic light colours.
Green
<75%
Indicates a good performance where conditions positively encourage EV adoption.
Amber
16 - 75%
Indicates limitations in provision where some of the drivers for adoption are just satisfactory.
Red
<16%
Indicates that a set of conditions exist that actively discourage or even block consumers from wanting or being able to buy an EV.
Index frequency and coverage
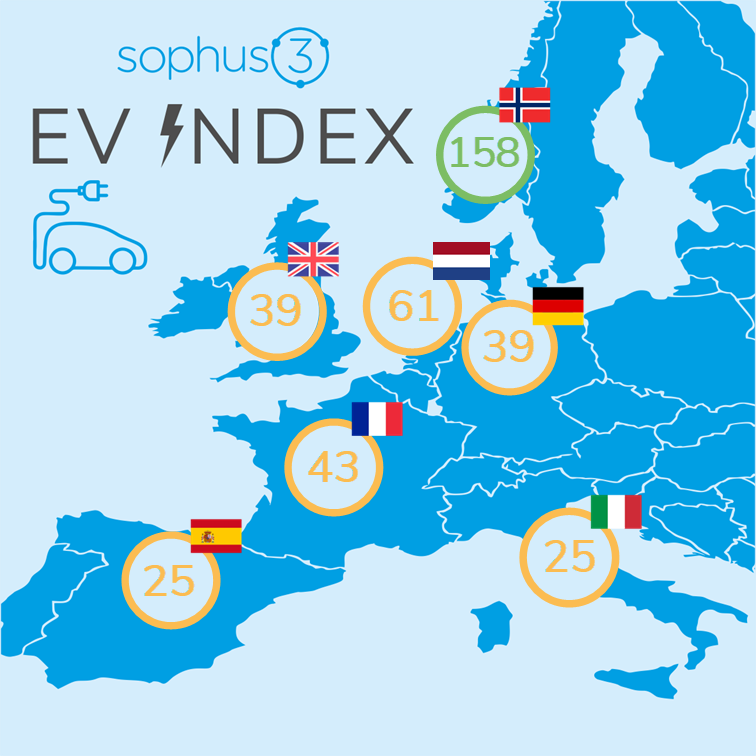
The Sophus3 EV Index is published quarterly and currently measures performance for the following markets:

UK

Germany

Spain

France

Italy

Norway

Netherlands
Find out more
Sophus3 makes the EV Index available for free to the many and varied interest groups following or promoting the growth of the electric vehicle sector, be they vehicle manufacturers, environmental groups, marketeers or governmental agencies.
In that spirit of openness we welcome comments and feedback, as well as suggestions as to how the index could be enhanced and used more effectively.
Contact: patrick.fuller@sophus3.com