

“The biggest story in the automotive ecosystem to sell and engage with customers digitally will lie in technology enablers such as Sophus3.”

Brands we work with


Latest Insight
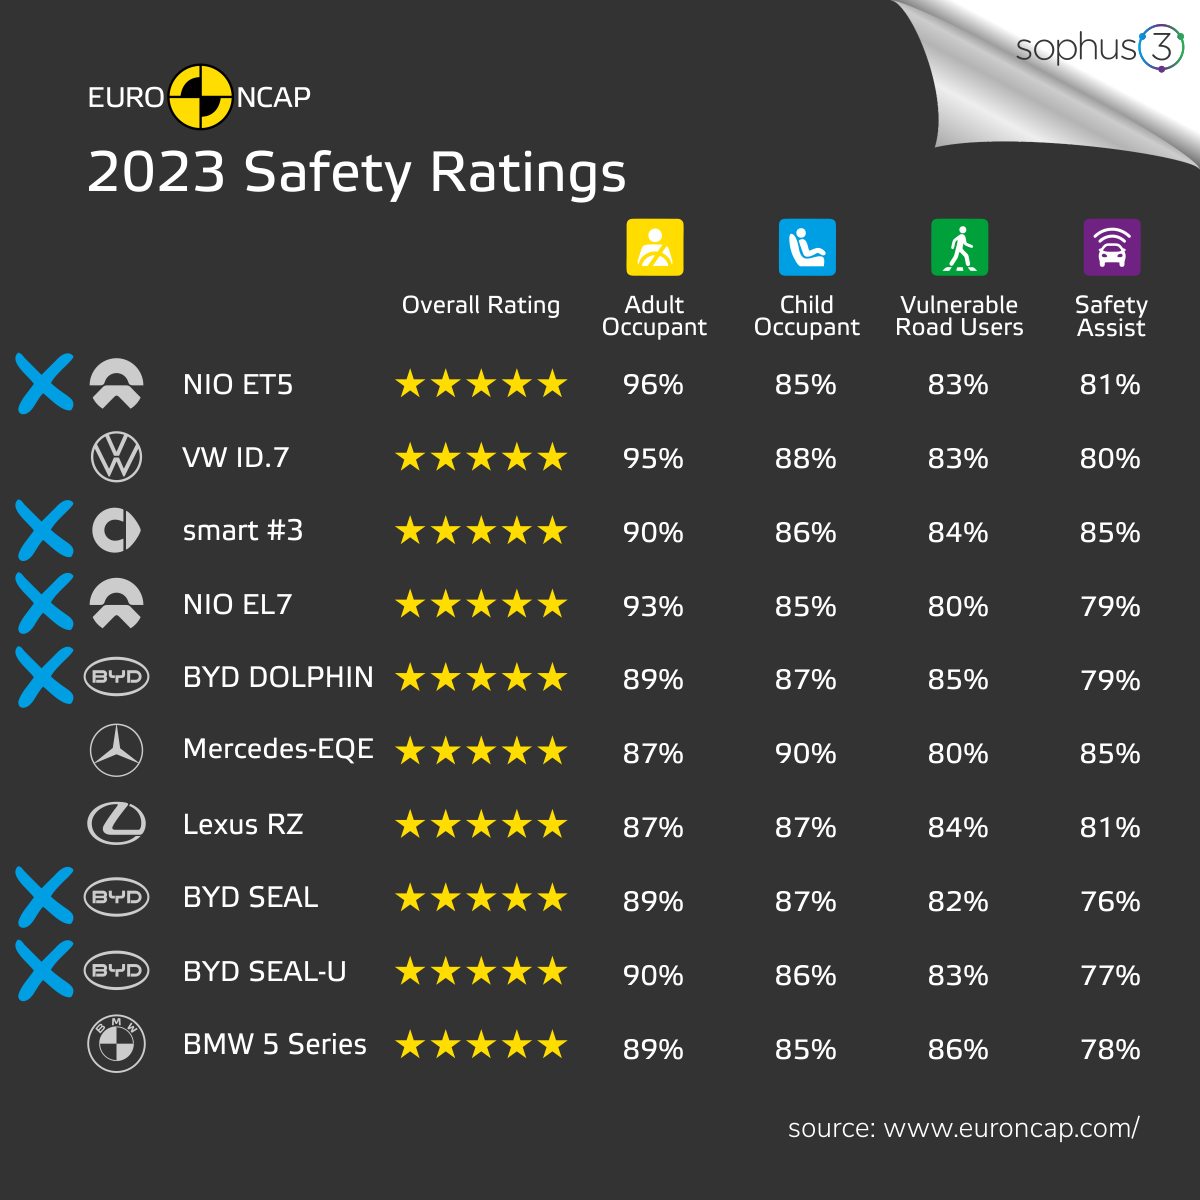
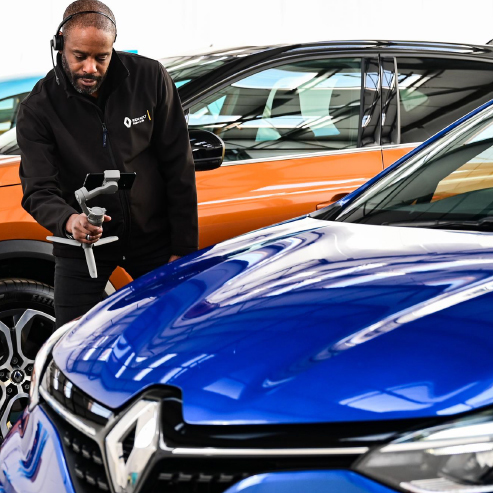
Chinese cars dominate latest safety ratings
Euro NCAP's latest ranking of car safety shows that Chinese brands are competitive on quality not just price.

Trends to watch in 2024
Key insights from our recent webinar ‘7 trends to watch in auto digital 2024’.
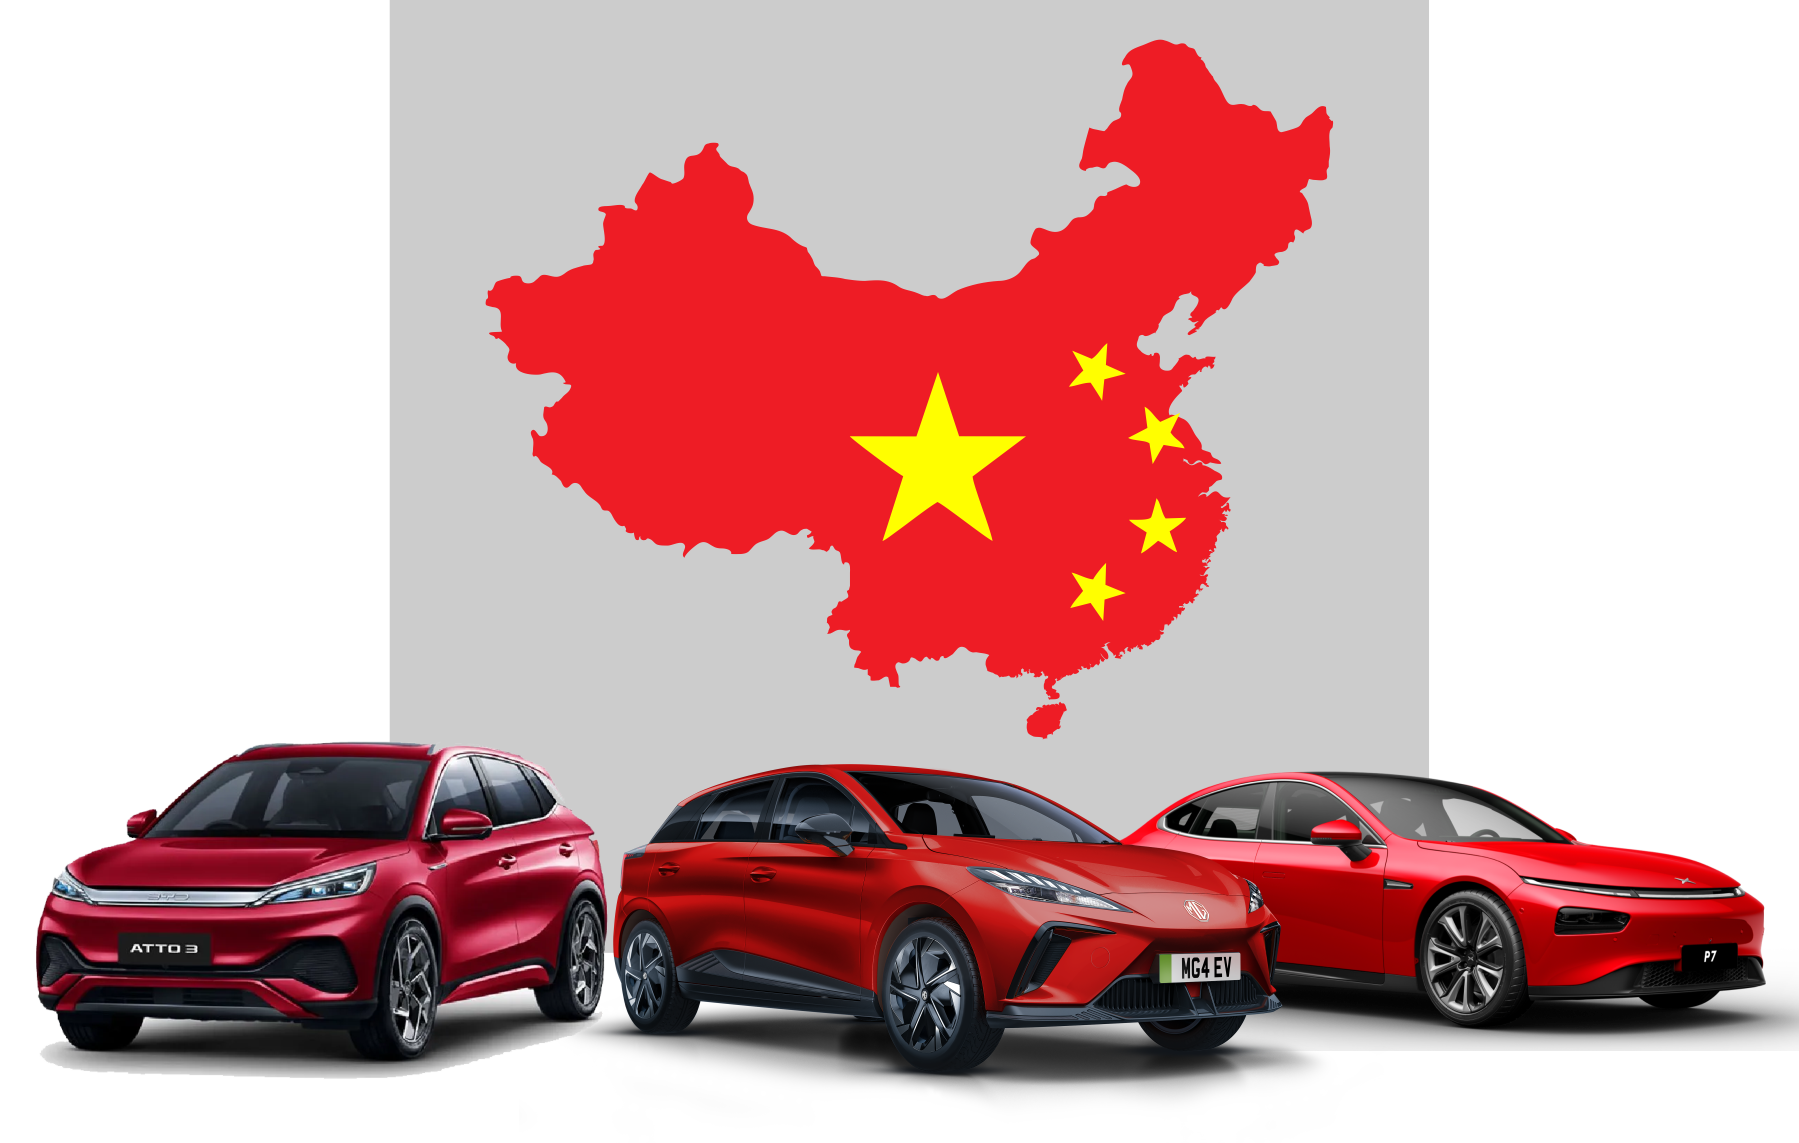
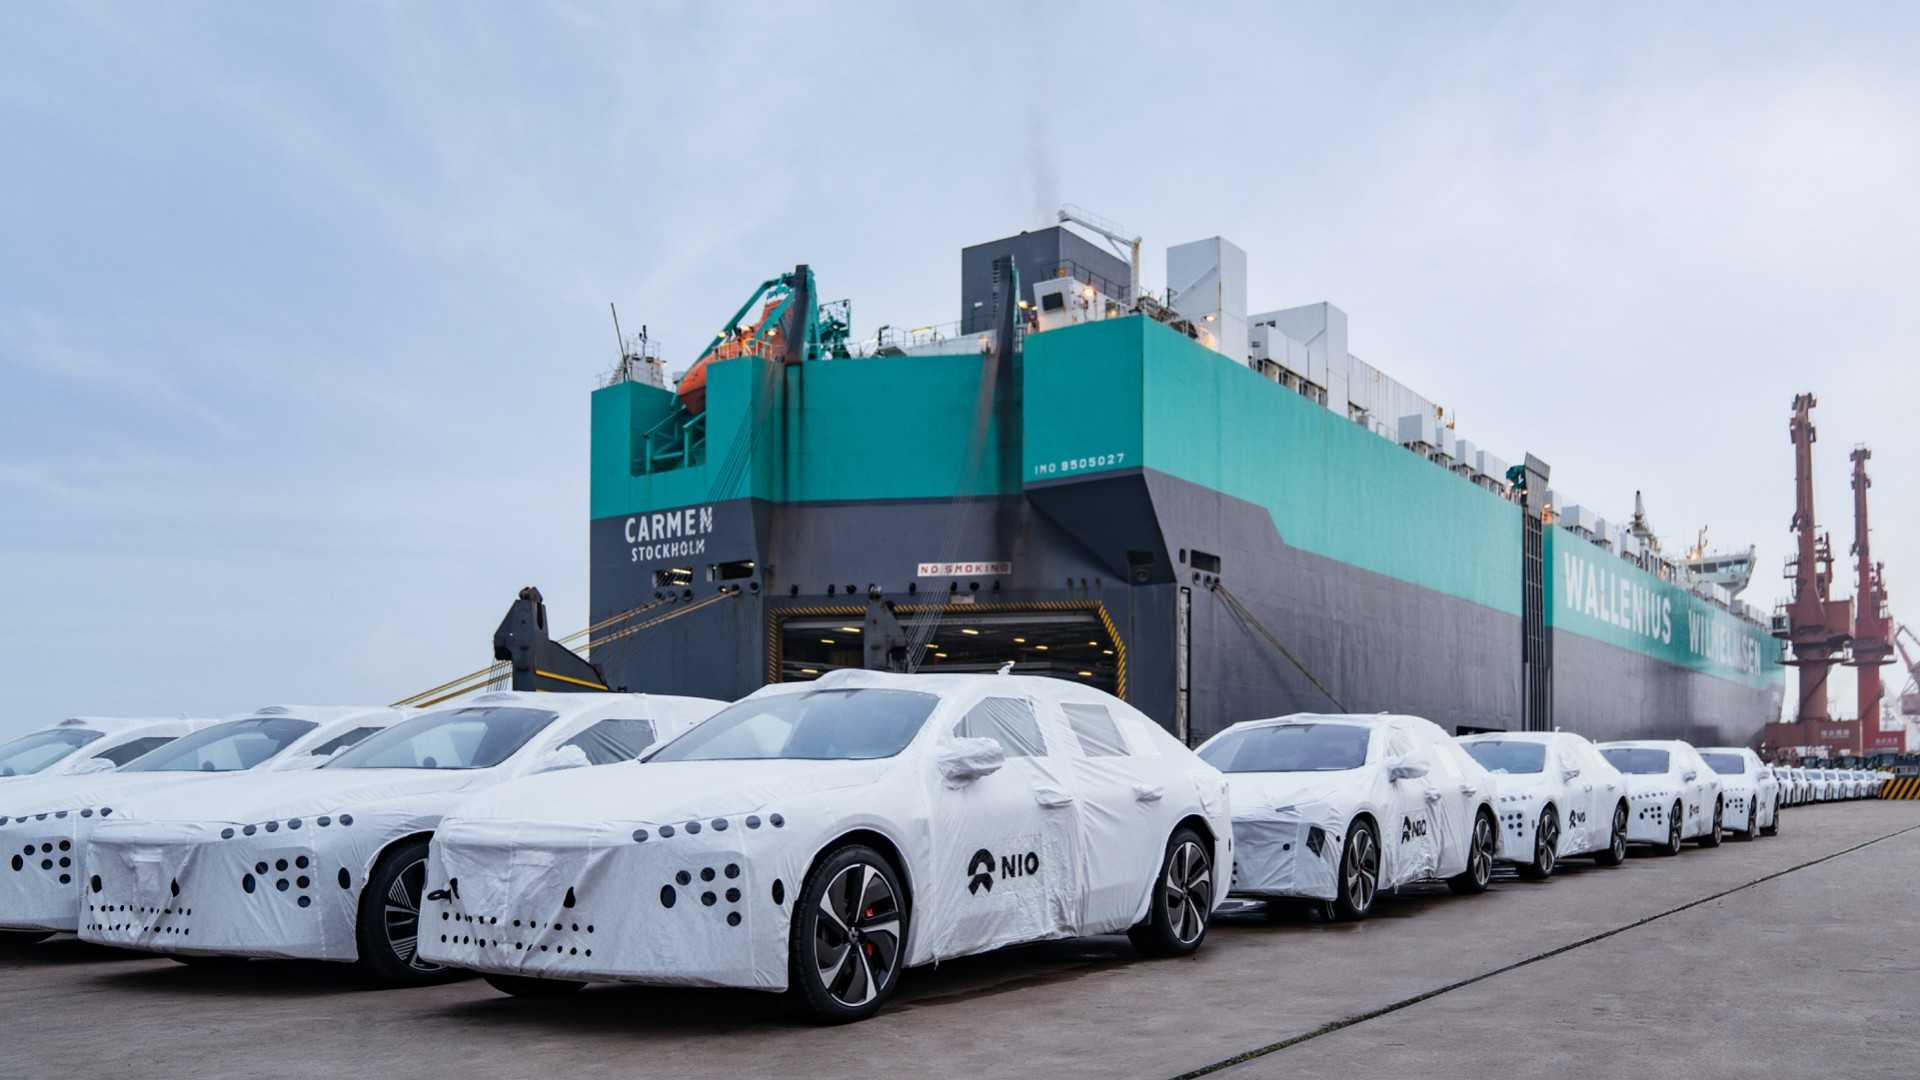
The Long March: Chinese car brands in Europe
Strong product, clear strategy, and rapidly increasing digital share. Why the European incumbents are sitting up and taking notice of these new market entrants.
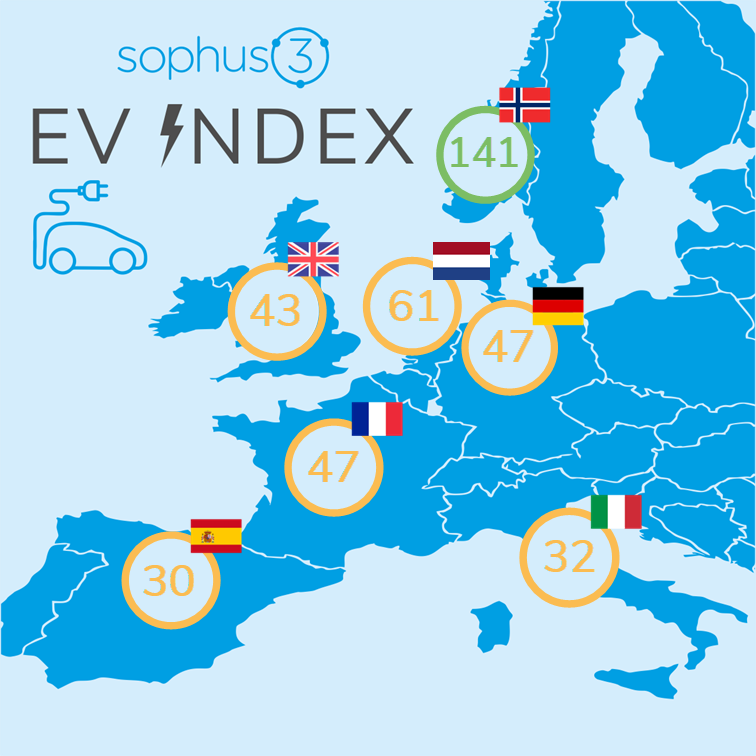
EV Index 2023 Q4: interest and sales stall
Electric vehicle sales are stalling and mass adoption in some European markets looks as far away as ever.
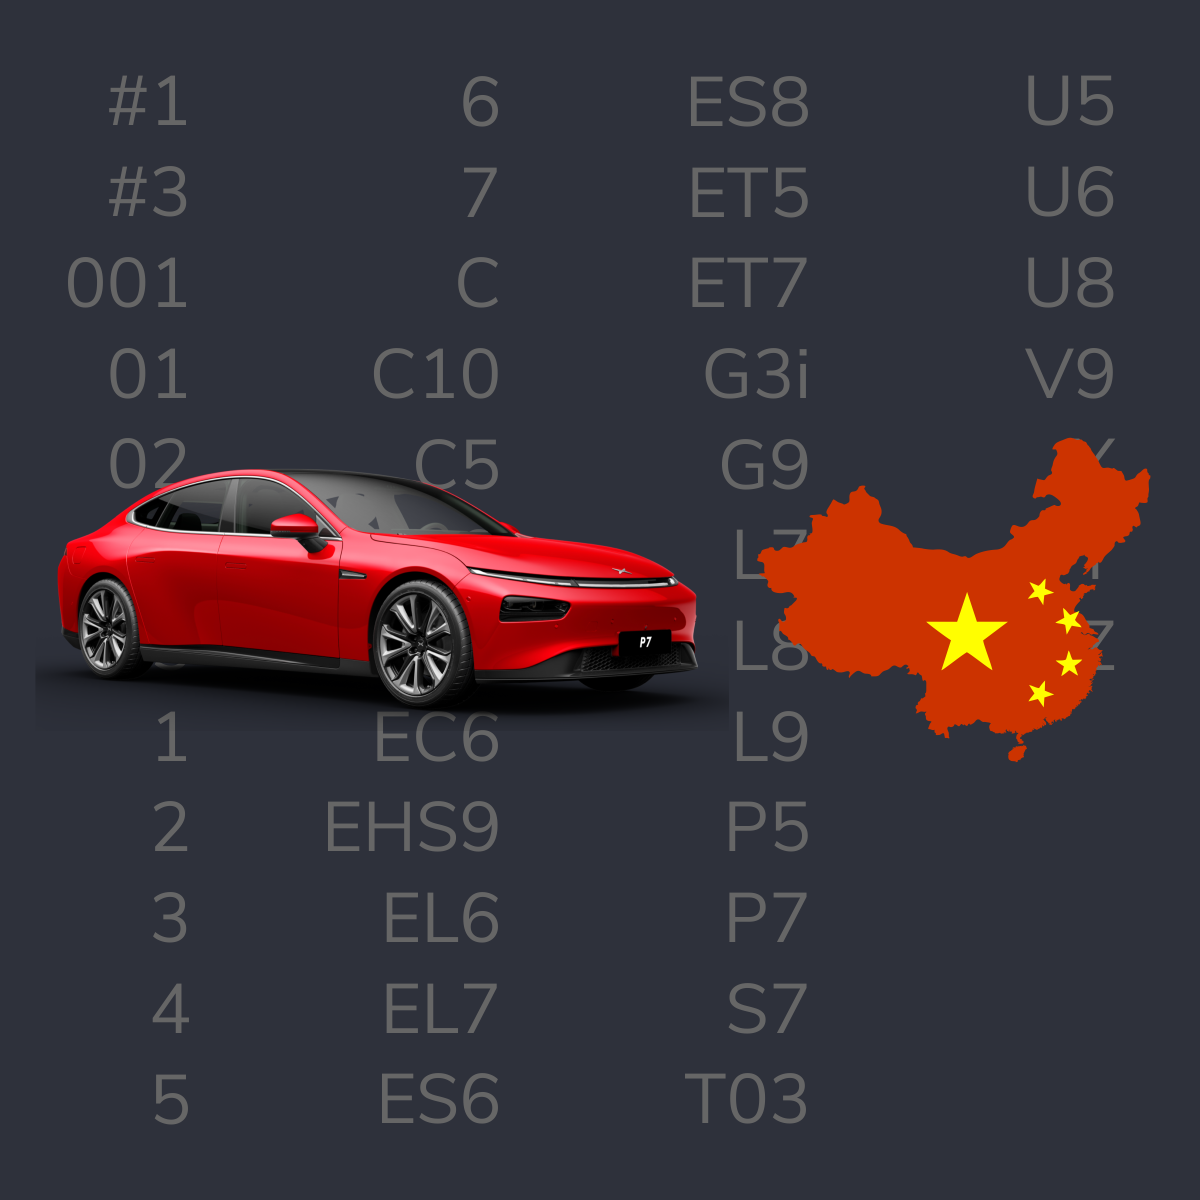
Quiz: Can you match these Chinese brands with their models?
The new market entrants are using a confusing array of alphanumeric names for their cars.
Video: Are your analytics adding business value?
We suggest three actions that can improve the insights car brands derive from their website analytics.
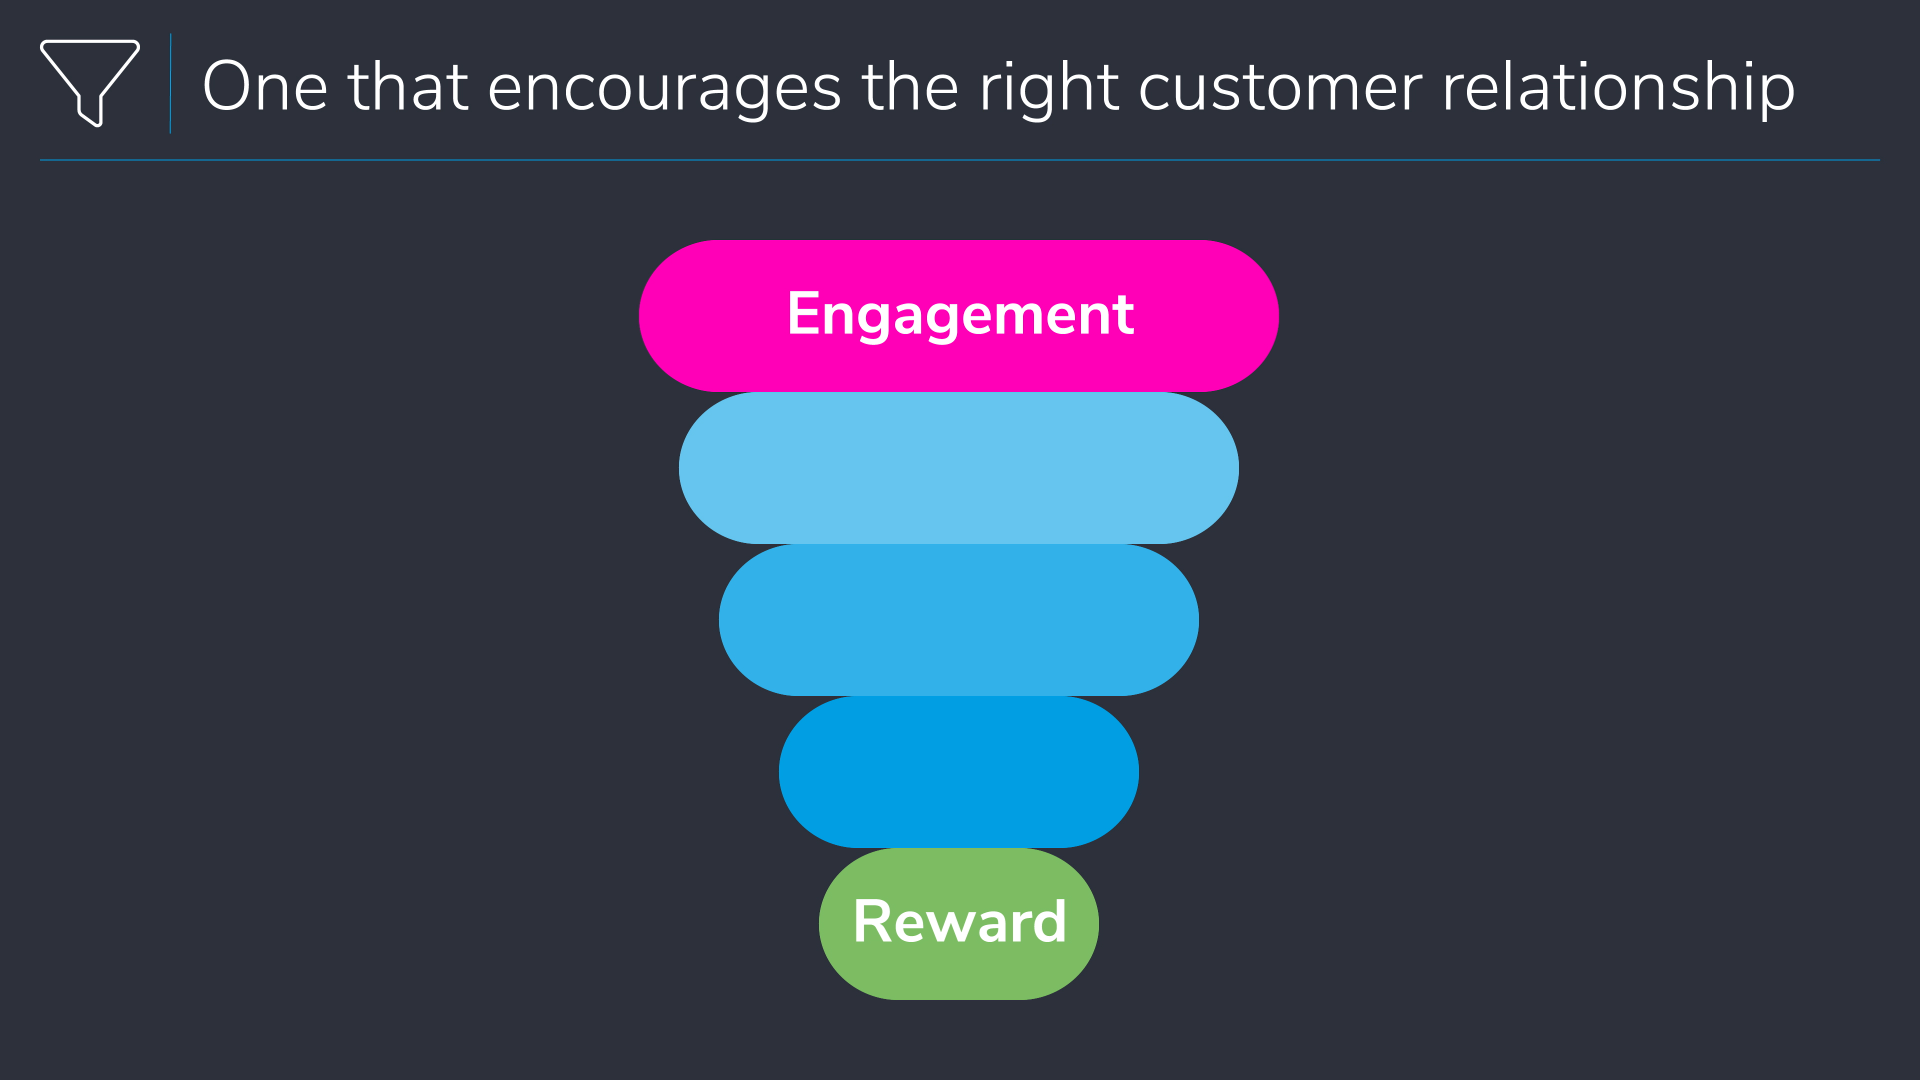
Video: Is the marketing funnel destroying customer experience?
Prioritising customer experience is key to car brands making a success of their ecommerce channels.
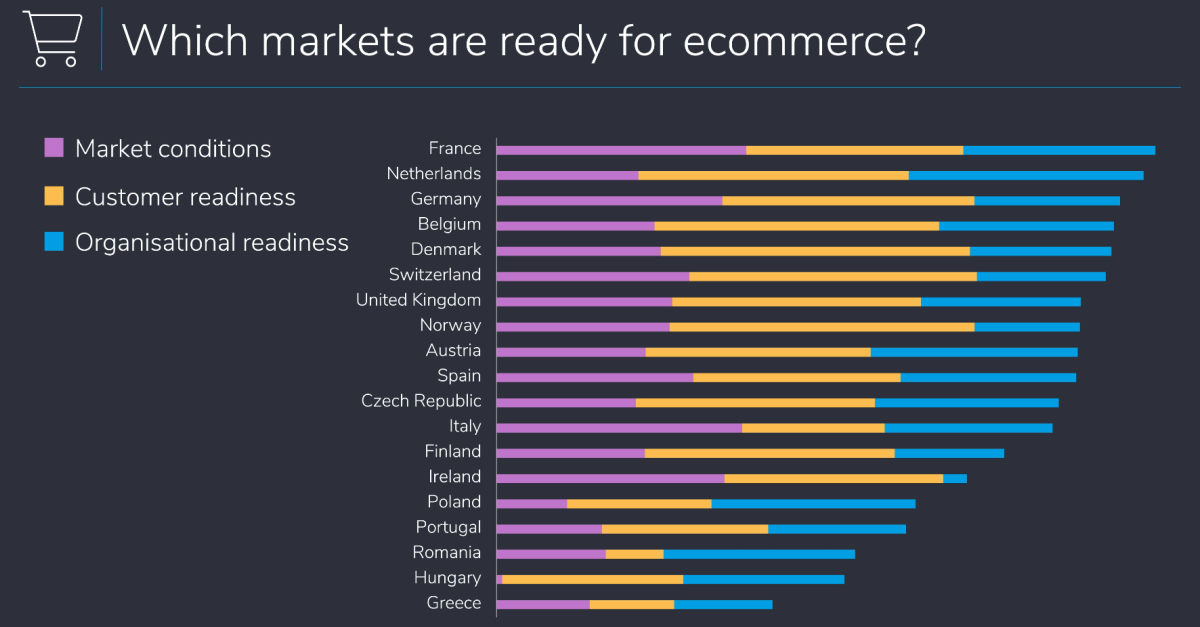
Video: Is your market ready for auto ecommerce?
How should car brands plan successful ecommerce rollouts?
Video: What are the digital capabilities of the Chinese car brands entering Europe?
There's been much speculation about the route to market for Chinese car brands, who are turning their attention to Europe as growth stalls in China.
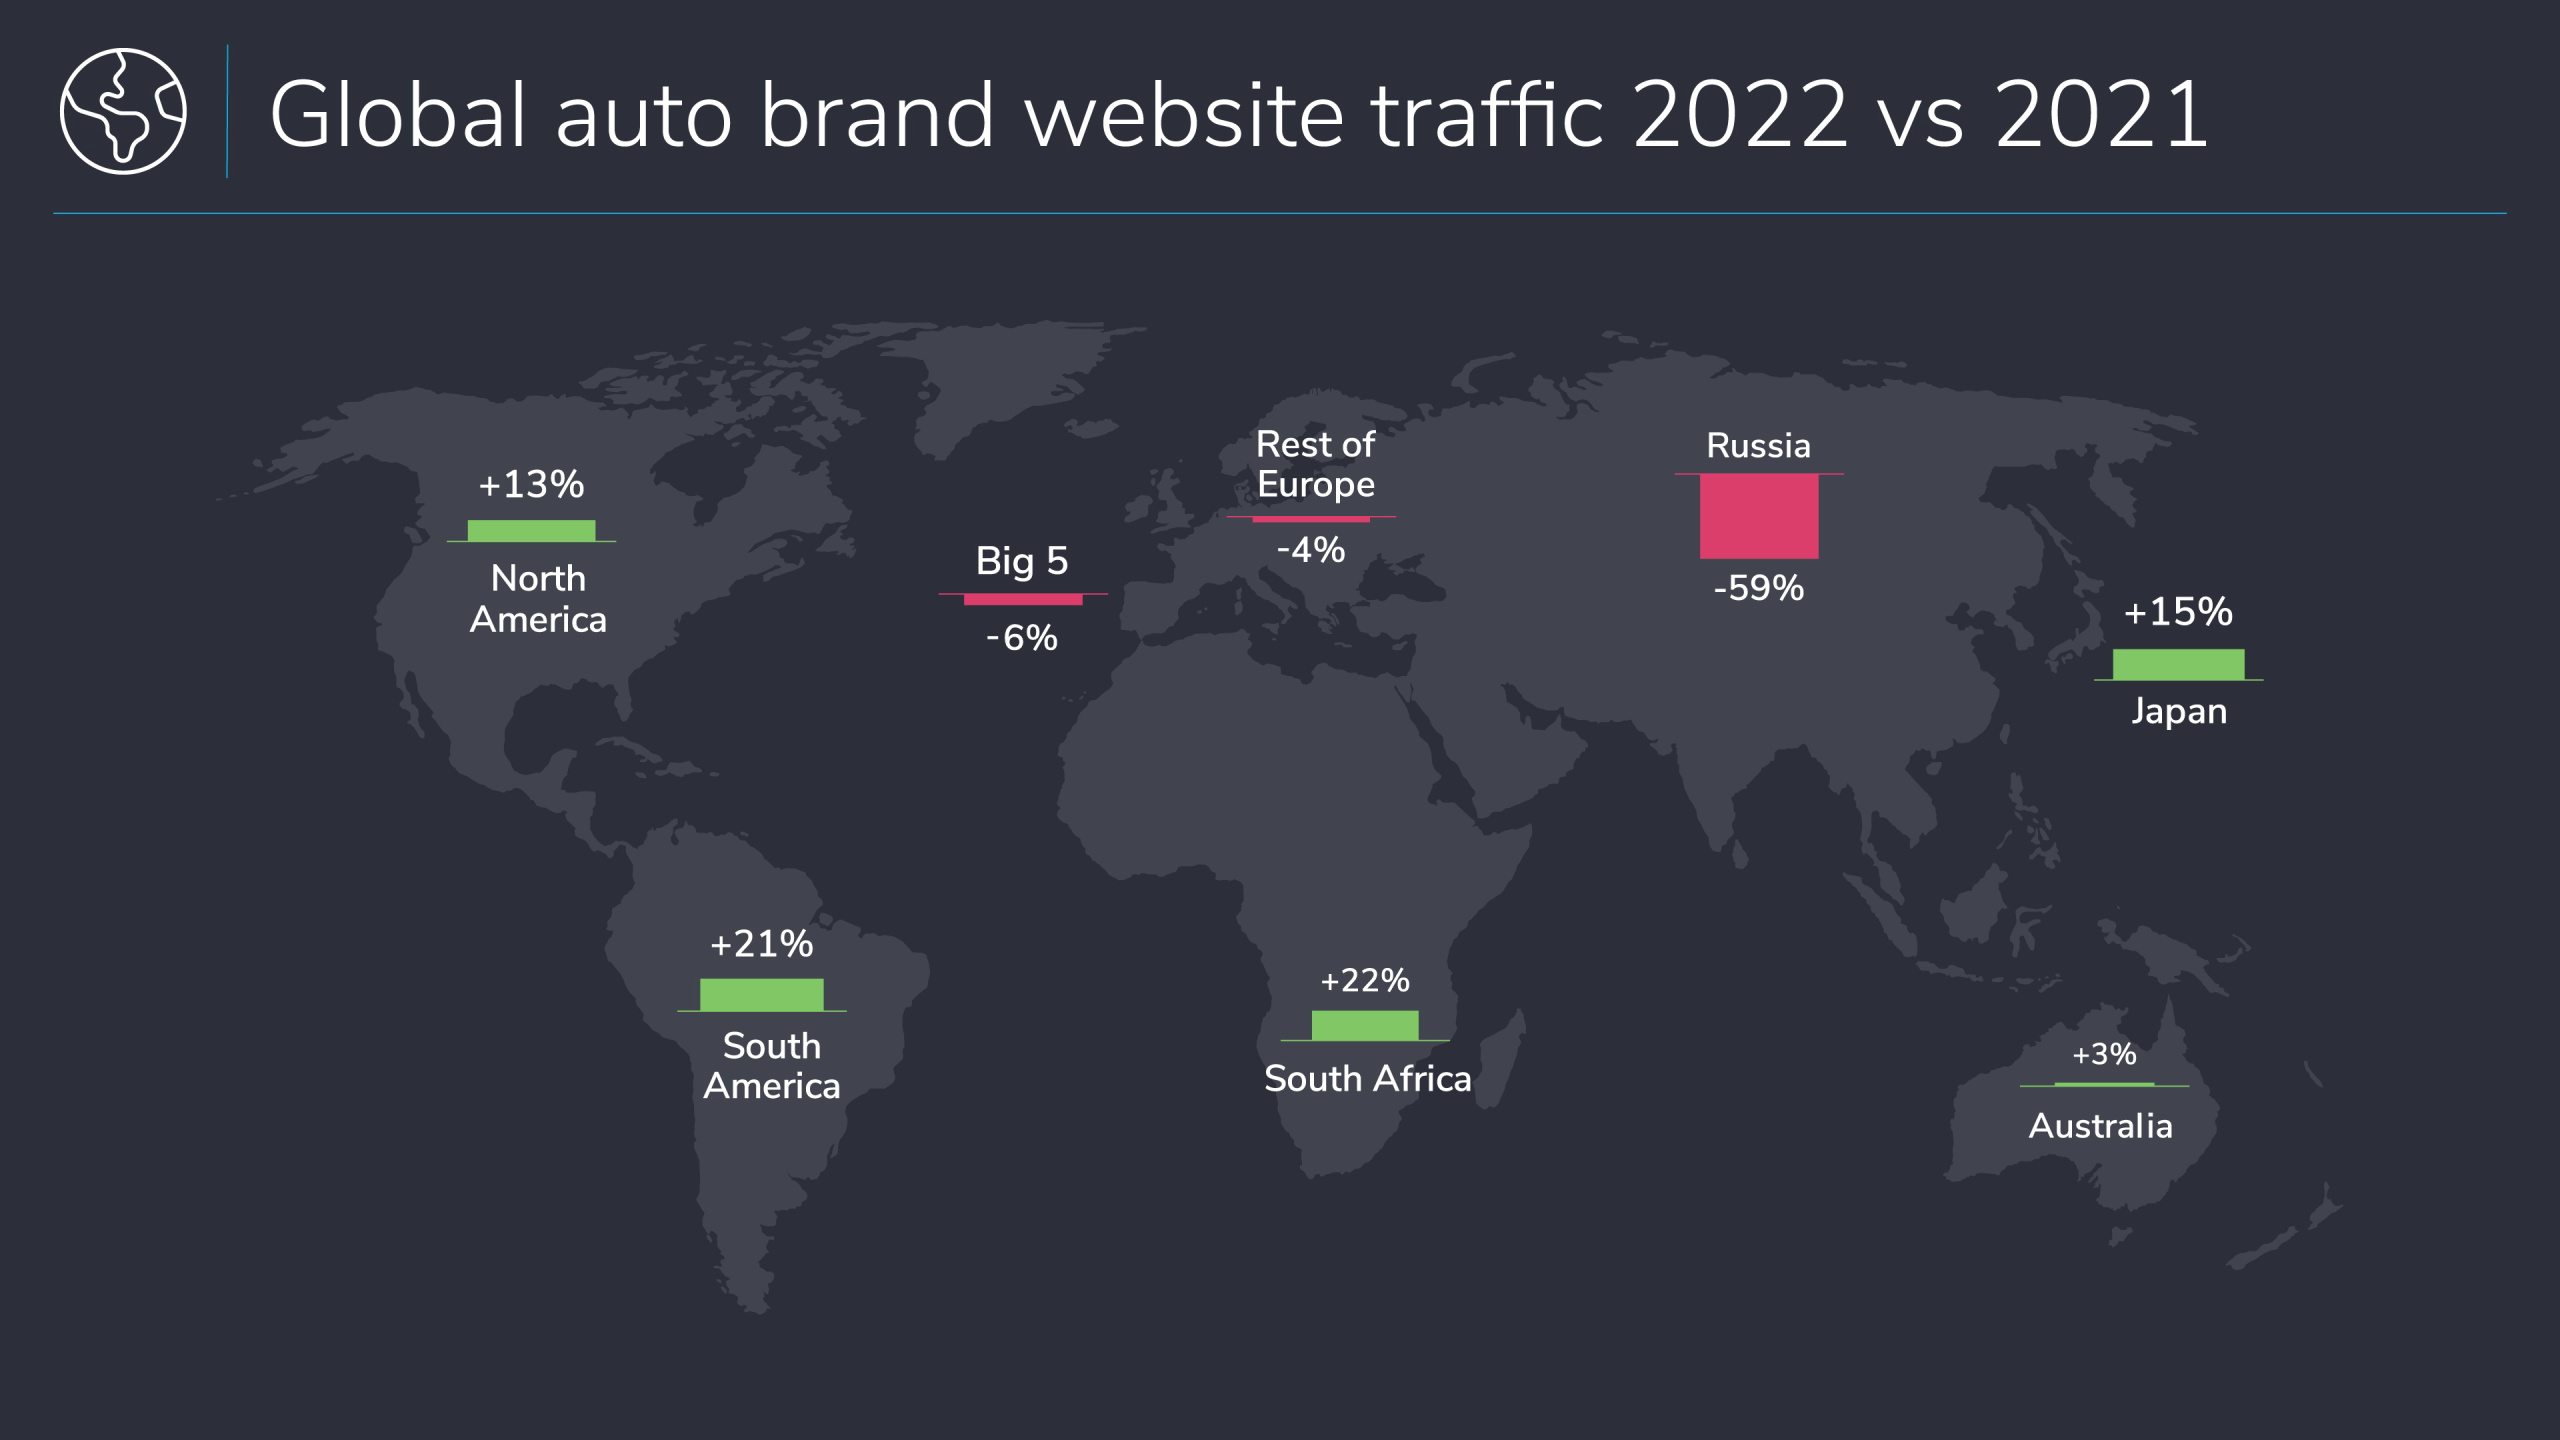
Video: Which automotive markets are growing in digital?
This extract from Sophus3’s Automotive Digital Summit 2023 looks at the differences in car-buyer interest in global regions and offers some explanation for the variations we found.
White Paper: Digital Car Buyer in Numbers 2023
Data and insight from Sophus3's Automotive Digital Summit 2023.
Video: What works best in automotive ecommerce?
In this 10-minute video, we analyse data from hundreds of automotive brand websites to reveal what works best in automotive ecommerce.
How ‘digital’ are Chinese challenger auto brands?
The second part of Sophus3's paper on Chinese OEMs in Europe surveys and comments on their digital capabilities.

Chinese auto brands coming to Europe: full report
This first part of Sophus3's paper on the entrance of Chinese car makers into Europe looks at the reasoning and strategy behind their move.

How to put the ‘human’ into auto ecommerce
Watch the latest episode from Sophus3's Automotive Digital Summit 2022.
White paper: Digital Car Buyer in Numbers 2022
Unique insights into automotive sector digital, campaign and sales activity.

Europe’s car brands are sleep-walking into historic levels of marketing inefficiency
Watch part 1 of highlights from the Sophus3 Automotive Digital Summit 2022.

What automotive can learn from other sectors in digital
DeLu Jackson shares insights as to how car brands can improve their digital performance.

How to navigate privacy without compromising your analytics
A combination of changes is upending the way car brands can track and interact with users of their digital channels.
White paper: Rethinking car buying in the ecommerce age
"The results shocked us. Not only did we see variations between the Big 5 markets, but also a patchy performance across the majority of brands, and very few examples of best practice."
Digital Car Buyer in Numbers 2021
Our annual review of the digital automotive year looks at the impact of the Coronavirus on the automotive industry and the further challenges it faces as the impact of the virus recedes.